The analytics reports, for a given month, is compiled immediately after the completion of that calendar month.
The quarterly report is compiled immediately after the completion of the financial year quarter period.
Authentication information for all accounts is available in KeePass.
Index
- Monthly analytics spreadsheet
- Website usage report
- DOL Analytics
- Google Cultural Institute (GCI)
- WordPress blogs
- The Loop audio tour
- Collection API
- Analysis
Monthly analytics spreadsheet
From the Records Management application, open the excel file below using the Edit option:
- Title: Multimedia and Web - Website statistics 2015-2020
- CM9 record no: D15/47955
Record data values from each website or applications below, in the appropriate fields on this spreadsheet.
Note on Bot traffic. If you notice unusual activity in traffic, in Google Analytics, follow the steps below to filter out bot traffic:
- From: Audience > Overview
- Select + Add Segment
- Select C language removed
- Apply
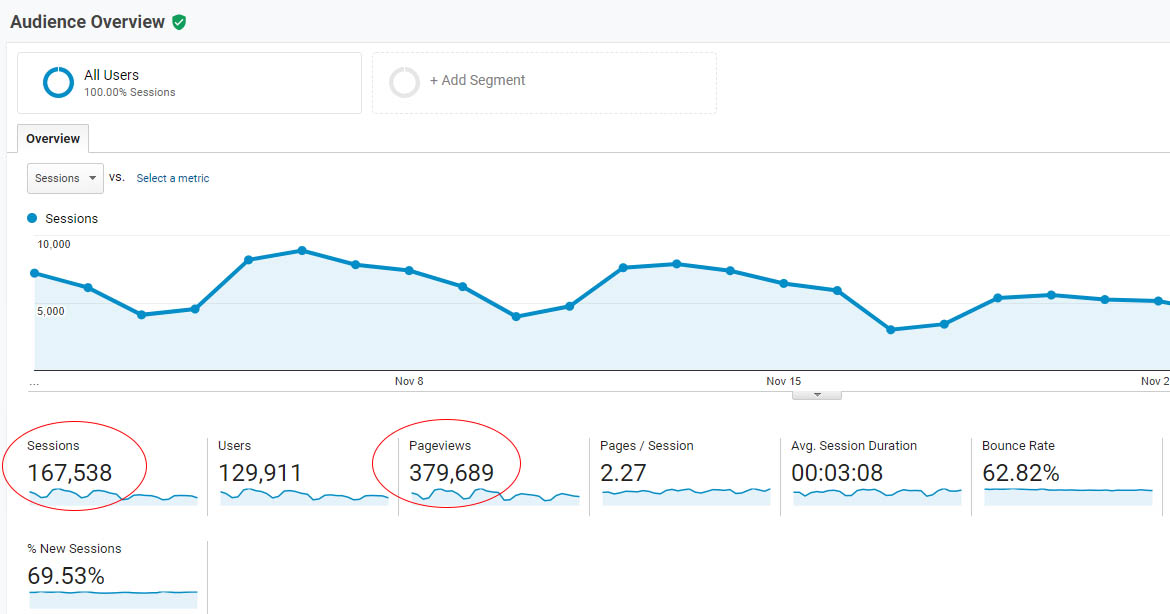
Website usage report
Visits and Page Views
- Logon to Google Analytics (uid: webmanager@nma.gov.au).
- From the accounts drop-down menu. select the 1. NMA Website profile (UA-18965158-1).
- From the left-hand pane, select Audience - Overview.
- Select the date range for the required period.
- Copy the Sessions and Pageviews values and insert it into corresponding cells in spreadsheet.
- Repeat steps 2 to 6 (above), for each of the remaining website profiles.
File download events
Download reports are available from Saved Reports page.
Ensure the active profile is nma.gov.au (UA-18965158-1).
- Select Customization
- Select Saved Reports
- Select one of the download reports (Download by month: x files)
- Change date range to current month.
Google search analytics
Ensure the active profile is nma.gov.au (UA-18965158-1).
- Select Acquisitions
- Select Search Console
- Choose from Queries, Landing pages, Devices and Countries
- Choose a date range.
NMA Internal search
- Select Behaviour
- Select Site search
- Choose a sub-menu item to get insights
- Choose a date range.
Focus on content area
- Select Behaviour >> Site Content >> All pages
- In the filter field add a part of url to filter by keyword - example /defining
- Use on page option to select secondary measurements, drill down, and more.
Note: existing reports by section are also available below, just ensure you change month date range:
Custimization >> Saved reports >> Monthly report x.
DOL analytics
- Login to Google Analytics (uid: webmanager@nma.gov.au)
- Select the 5. DOL profile (UA-18965158-22)
- Select Audience, Overview
- Select the correct date range for the month
- Copy and paste the values for Sessions and Pageviews into the corresponding fields on the spreadsheet.
Google Cultural Institute (GCI)
Note: GCI reports are generated on about the 5th of each month for the previous month.
- Login to GCI (uid: nationalmuseumofaustralia@gmail.com).
- From the left-hand pane, select Statistics.
- From the top menu, 'Select month' then Export
- Open the downloaded files
Results
- Sessions: From viewers_yyyy-mm.csv file, add Daily viewers sum column to get total Sessions for the month.
- Page views: page_views_yyyy-mm.csv file, add Views column to get total Page views for the month.
Note: Ensure your primary account on your Google Chrome session is 'nationalmuseumofaustralia@gmail.com', otherwise a 'Forbidden' error will appear.

WordPress blogs
PATE, Daimler and Inside blogs
- Logon to the Wordperss (uid: nmapate)
- From the top left logo pane, select My Sites > Switch Site, then select the corresponding site.
- From left-hand pane, select 'Stats'.
- Select the 'Months' tab, above the graph.
- When the graph reloads, hover over the appropriate month.
- Copy the values from Visitors and Views and insert into statistics spreadsheet.
The Loop audio tour (Flurry analytics)
Usage overview
The following steps should be done individually for iOS and Android apps.
- Login to Flurry explorer (account: webmanager@nma.gov.au)
- Select the Analytics option on left pane
- Select Usage >> App Summary
- From the + APP or APP GROUP button, at the top of page, select one of the profiles (iOS or Android)
- From the date range picker, top-right of page, select the dates for the month
- Copy and paste values for 'New Devices, 'Active Devices' and 'Sessions' into the spreadsheet.
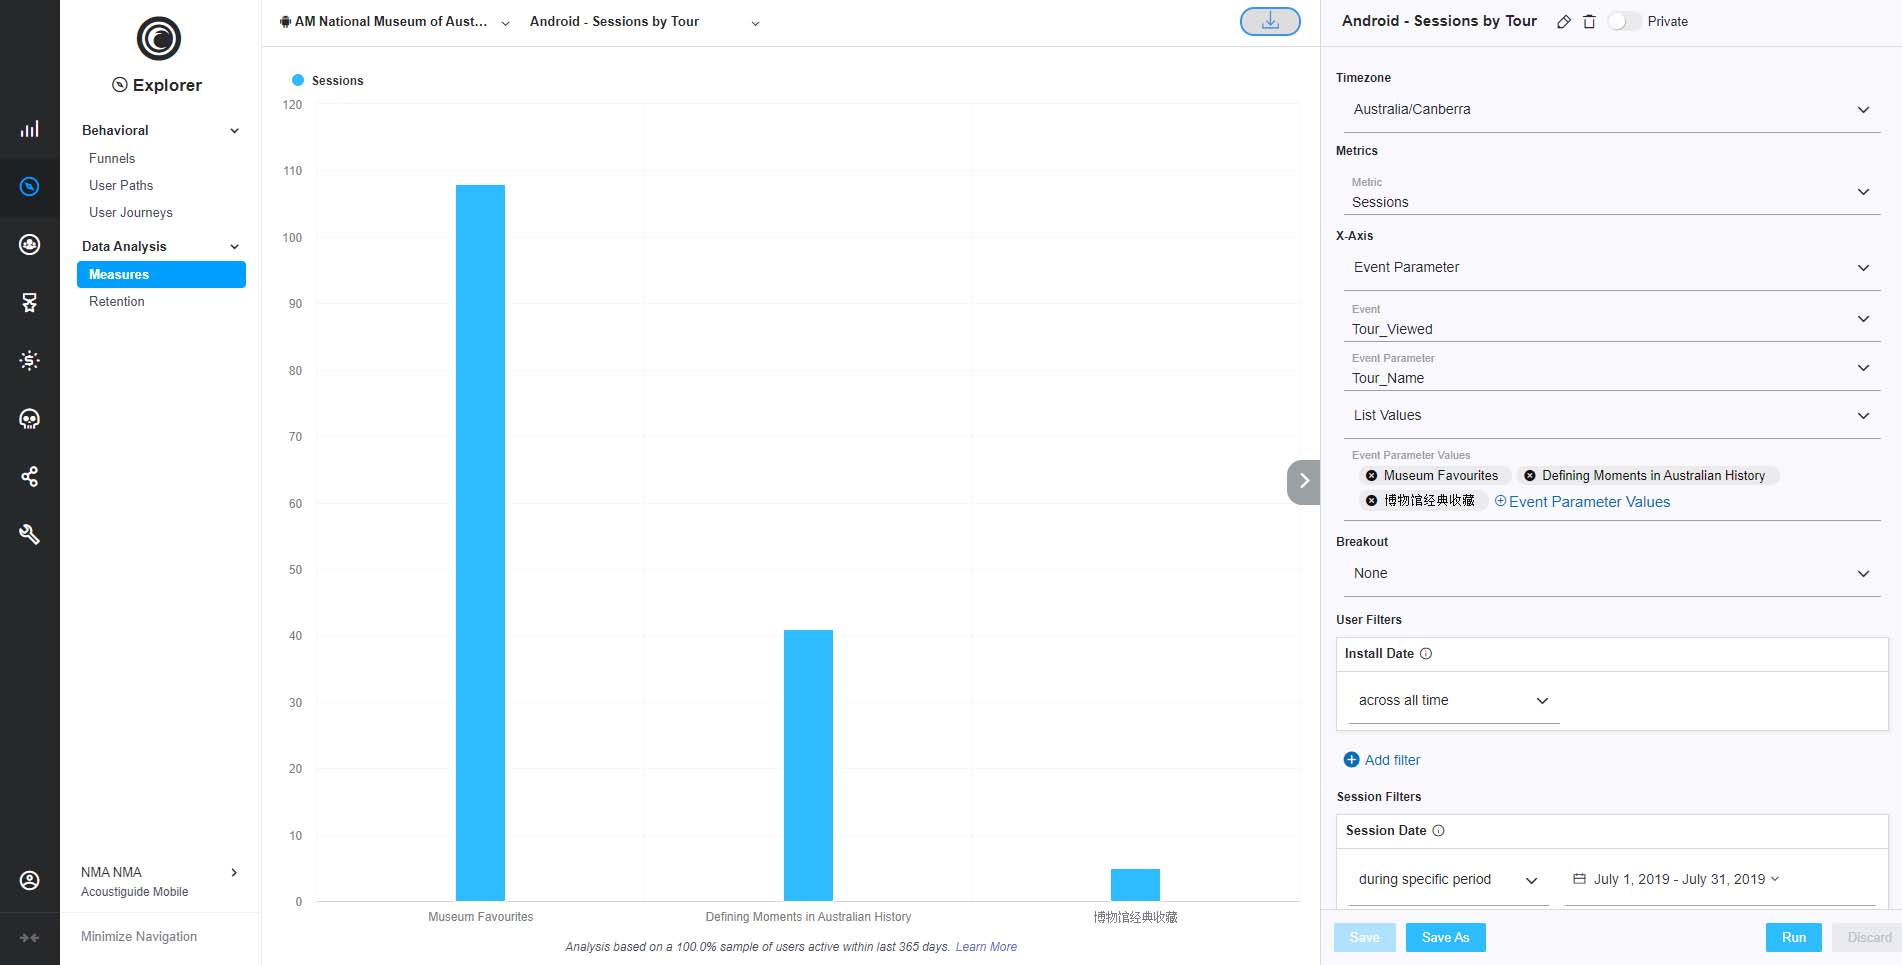
Usage by tour
The following steps should be done individually for iOS and Android apps.
- From the left pane, select the Explorer option
- Select Data Analysis >> Measures
- Select the corresponding App, from the top of the page, then Android Sessions by Tour/iOS Sessions by Tour)
- Ensure all Tours are added to 'Event Parameter Values'
- Ensure 'User Filters' >> 'Install date' is set to 'across all time'
- Under 'Session Filters' select the date range for the month
- Select the Run button, bottom-right of page
- Hover over the graph bars to get session results by each tour.
Collection API
- Navigate to https://data.nma.gov.au/dashboard/
Note: Use Firefox browser and ensure the url includes the slash at the end of it. - From the list of filters, use the Month filter to select the month
- Select the Apply filter button
- Add the values to the spreadsheet as follows:
- Number of users: The total number of users in the User id column, minus the anonymous and any Fiona Wood IDs.
- Number of API call: Found at the end of the page, under API calls, and is the total as stated in the heading.
Analysis
Select the 'Analysis' tab on the statistics spreadsheet and add your comments and observations based on the statistics, referencing any special museum events.
Analysis is provided monthly, quarterly and annually.