For an overview of app usage use Flurry analytics.
For a breakdown of tours and writing more complex queries use Flurry explorer.
Flurry explorer
- Browse to Flurry Explorer
- From left-hand menu, select Explorer then Measures
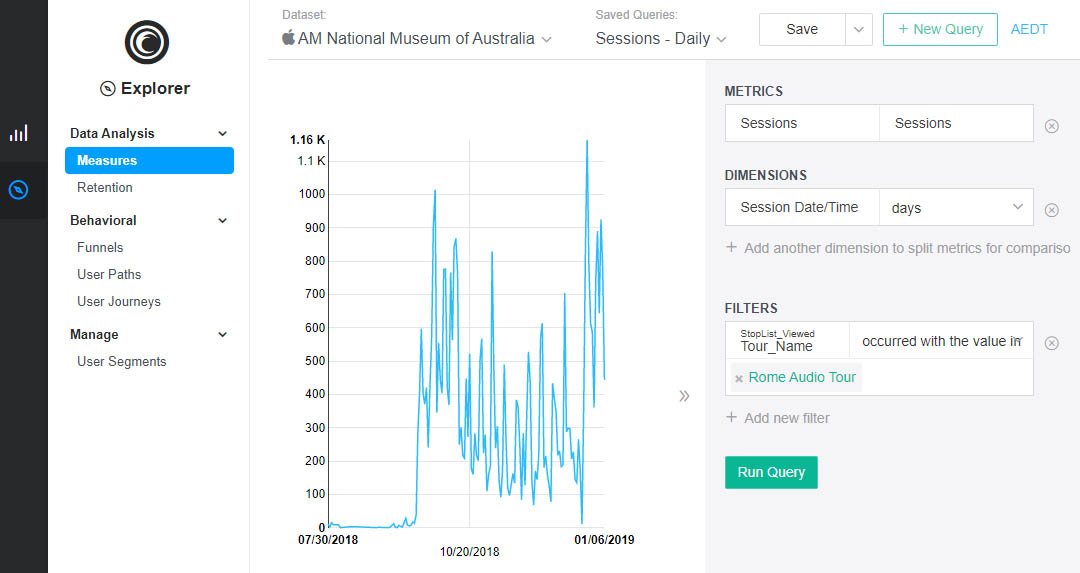
- From the top right menu bar, select + New Query
- From the Dataset menu (top bar), select the medium (Android/Apple)
- From the Saved Queries, select a query (eg Daily sessions on tour)
- From the Metrics menu, select a metric
- From the Dimensions menu, select a dimension
- From the Filters menu, select a filter type
Hint: To filter by Tour, select Event Param, then ‘Tour_Name', then (in the field below) type a tour name to query. - Select Run Query.
- Select Save button, to save report, and or export to csv to download data.