Total on-site visitation to the Museum exceeded target, with 661,693 visitors to Acton. Visitation to the Museum’s temporary exhibitions performed well, with over 83,000 visiting The Home Front: Australia during the First World War, Spirited: Australia’s Horse Story, and Old Masters: Australia’s Great Bark Artists. This exceeded last year’s visitation by over 13 per cent.
The Museum’s events and function-hire numbers continued to grow, following the redevelopment of venue facilities at the Museum. The increase in numbers was attributed to the Museum broadening its function base, and hosting events from weddings and private dinners through to corporate events, and regular opening of the Museum Bar.
Attendance at public programs exceeded target by 32 per cent. Key highlights included access programs, school holiday programs and festival days.
Schools continue to visit the Museum in large numbers, with over 85,000 students visiting this year in total.
The Museum recorded its largest number of visitors to travelling exhibitions nationally since the Museum opened in 2001. Over 800,000 Australians saw one of the three exhibitions on tour: Warakurna: All the Stories Got into our Minds and Eyes, Inside: Life in Children’s Homes and Institutions and Freewheeling: Cycling in Australia. Warakurna toured throughout regional areas in South Australia and the Northern Territory.
The Museum’s international touring program was also very successful. In conjunction with the Department of Foreign Affairs and Trade, and with the assistance of Australian diplomatic missions, the Museum toured a panel display of Yiwarra Kuju: The Canning Stock Route to China, Turkey, Chile, India, the Philippines, Japan, Mexico, Thailand, Russia, Tonga and Indonesia. A total of 347,238 visitors viewed the exhibition.
Monthly web visitation figures, 2014–15
Month | Visitation |
|---|---|
| Jul | 131,737 |
| Aug | 174,628 |
| Sep | 152,815 |
| Oct | 156,752 |
| Nov | 129,129 |
| Dec | 75,950 |
| Jan | 100,331 |
| Feb | 115,928 |
| Mar | 178,736 |
| Apr | 141,278 |
| May | 186,555 |
| Jun | 150,479 |
| Total | 1,694,318 |
Breakdown of visitation numbers (excluding web visitation) 2009–14
| 2009–10 | 2010–11 | 2011–12 | 2012–13 | 2013–14 | 2014–15 | |
|---|---|---|---|---|---|---|
| Permanent exhibitions | 489,888 | 447,598 | 407,786 | 452,947 | 423,691 | 436,496 |
| Temporary exhibitions* | 91,464 | 255,380 | 197,092 | 73,413 | 57,304 | 83,314 |
| Travelling exhibitions and remote digital programs | 163,388 | 736,811 | 753,387 | 85,186 | 127,326 | 1,246,185 |
| Public programs and events | 28,166 | 36,653 | 37,891 | 27,541 | 32,028 | 43,556 |
| Schools | 88,981 | 83,293 | 84,282 | 87,263 | 83,642 | 85,473 |
| Functions/venue hire | 18,143 | 20,839 | 6,404 | 1,324 | 5154 | 12,854 |
| Total | 880,030 | 1,580,574 | 1,486,842 | 727,674 | 729,145 | 1,907,878 |
*Visitation figures for temporary exhibitions do not include visits to the First Australians Focus Gallery, which, because of its location, are included in the permanent gallery figures.
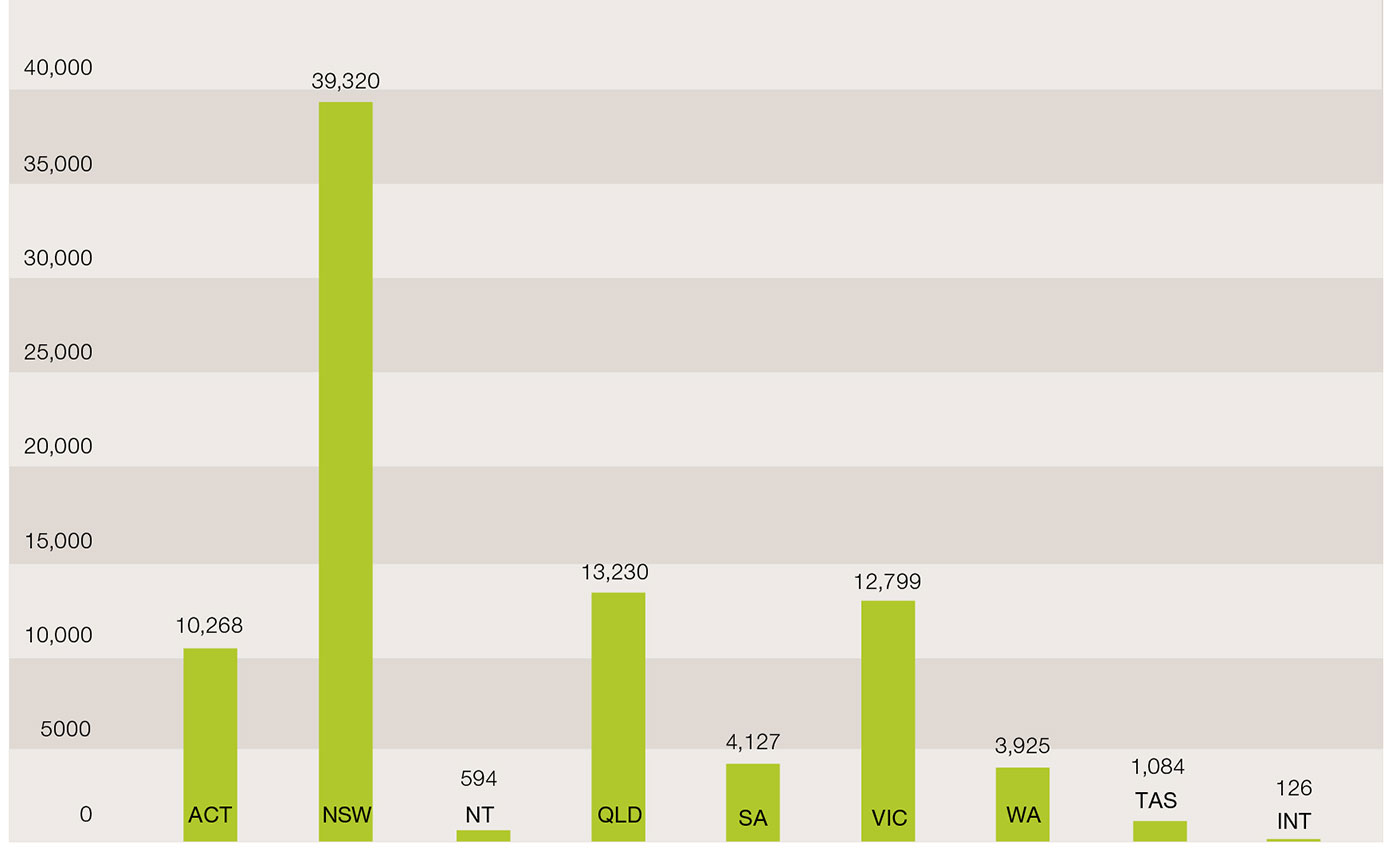
Number of students visiting per state and from overseas, 2014–15
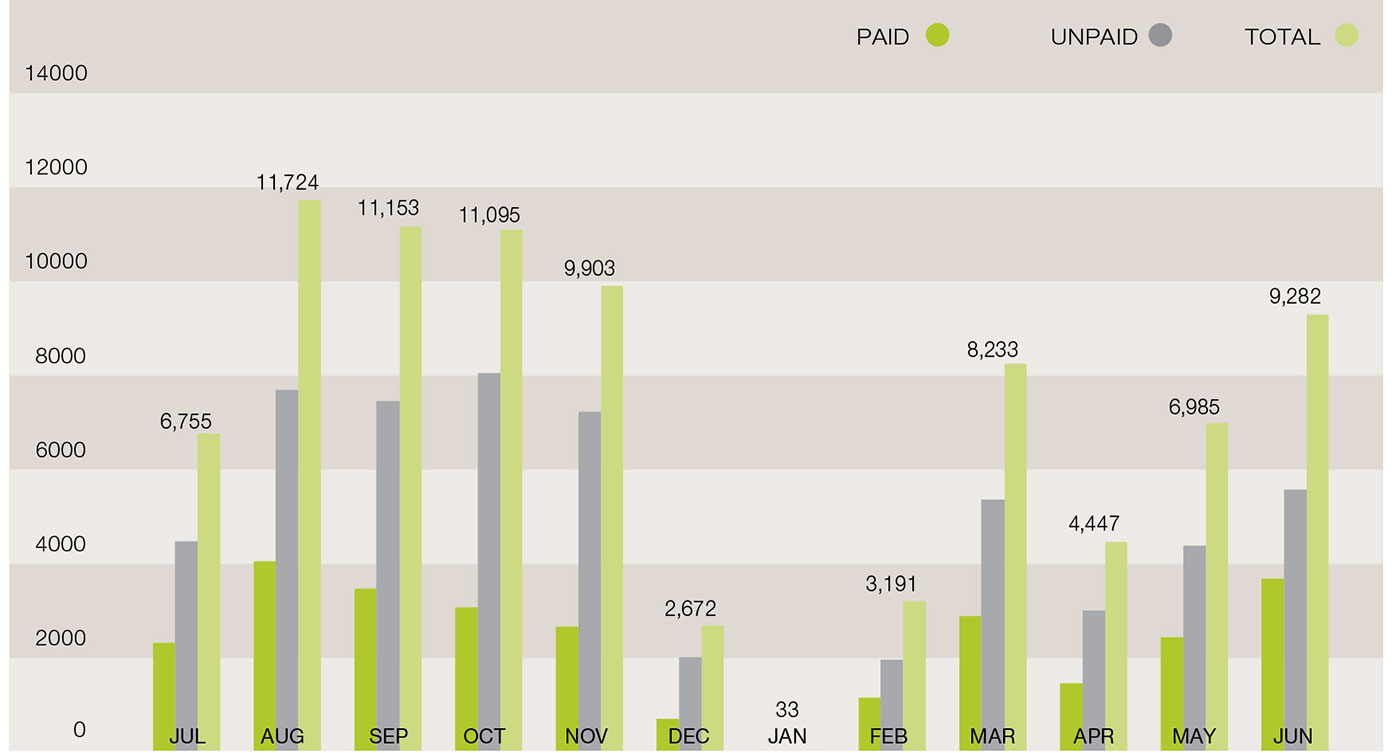
Number of paid program visits versus unpaid teacher-guided visits, 2014–15
Audience and visitor research
The Museum conducts interviews to obtain audience feedback and invites visitors to provide written feedback through a variety of channels, including forms, online feedback, and through visitor services hosts. During 2014–15, the Museum conducted 614 surveys for a variety of Museum programs. Of these:
- 95 per cent of visitors were satisfied or very satisfied with their visit
- first-time visitors made up 40 per cent of those surveyed, while 38 per cent were frequent visitors to the Museum and had visited the Museum up to four times in the past 12 months
- 50 per cent of the Museum’s visitors were in a family group with children
- the majority (80 per cent) of participants in the Museum’s public programs live in the Australian Capital Territory, while 17 per cent are from interstate
- there was a continuing trend of approximately 12 per cent of visitors visiting from overseas.
A focus on client service
The Museum’s Client Service Charter is available to the public on the Museum’s website. During the year, the Museum received 226 written comments from visitors using the Visitor Feedback form, which was about 30 per cent fewer than the previous year. The majority of feedback comments were general remarks, questions and suggestions.
Approximately 20 per cent of feedback was positive, and half of the positive responses referred to the Museum’s staff/service, galleries and exhibitions. Negative feedback accounted for about 20 per cent of total references with wayfinding, car parking, staff and the Museum Cafe accounting for the majority of this feedback.
The Museum received 859 emails through information@nma.gov.au. This is a decrease of 61 per cent compared to emails received in 2013–14. These emails covered a range of enquiries related to Museum cafe bookings and venue hire, school and educational tours, conservation of items, object donations, historical event/object curatorial research, requests for copyrighted audio and visual media, and in-store and online products from the shop.