Total visitation to the Museum’s programs, travelling exhibitions and main Acton site was on target this year. Visitation to the Museum’s travelling exhibitions exceeded targets by nearly 21 per cent, with the national tours of Yiwarra Kuju: The Canning Stock Route and A Different Time: The Expedition Photographs of Herbert Basedow 1903–1928 coming to an end and the continuation of Inside: Children’s Homes and Institutions, and the banner display Places that Matter.
The Museum’s events and function hire numbers performed well above target, reflecting the reopening of rooms and spaces following extensive redevelopment during 2011 and 2012. It is anticipated that these numbers will continue to grow.
Visitation to public programs was on target overall, with some school holiday programs in the Discovery Space recording the Museum’s highest ever daily visitation rates since opening in 2001. The popularity of programs such as Museum maestros and Rock stories indicate that the music and performance themes of the programs resonated with visitors.
The number of school students visiting the Museum totalled 83,642.
Visitation to the two major temporary exhibitions at the Museum was strong. Glorious Days: Australia 1913 (open from 7 March to 13 October 2013) attracted 23,481 visitors in the reporting period (52,501 visitors in total); and Old Masters: Australia’s Great Bark Artists (open from 6 December 2013 to 20 July 2014) attracted 38,823 visitors (41,003 in total). The exhibitions appealed strongly to overseas visitors, particularly with a number of high-level delegations visiting the Museum during 2013–14.
Monthly web visitation figures, 2013–14
| Month | Visitation |
|---|---|
| July | 119,172 |
| August | 149,769 |
| September | 122,782 |
| October | 117,693 |
| November | 100,570 |
| December | 79,104 |
| January | 100,596 |
| February | 116,914 |
| March | 137,442 |
| April | 115,889 |
| May | 152,265 |
| June | 125,276 |
| Total | 1,437,472 |
Breakdown of visitation numbers (excluding web visitation) 2009–14
| Year | 2009–10 | 2010–11 | 2011–12 | 2012–13 | 2013–14 |
|---|---|---|---|---|---|
| Permanent exhibitions | 489,888 | 447,598 | 407,786 | 452,947 | 423,691 |
| Temporary exhibitions* | 91,464 | 255,380 | 197,092 | 73,413 | 57,304 |
| Travelling exhibitions | 163,388 | 736,811 | 753,387 | 85,186 | 127,326 |
| Public programs and events | 28,166 | 36,653 | 37,891 | 27,541 | 32,028 |
| Schools | 88,981 | 83,293 | 84,282 | 87,263 | 83,642 |
| Functions/venue hire | 18,143 | 20,839 | 6404 | 1324 | 5154 |
| Total | 880,030 | 1,580,574 | 1,486,842 | 727,674 | 729,145 |
*Visitation figures for temporary exhibitions do not include visits to the First Australians Focus Gallery, which, because of its location, are included in the permanent gallery figures.
Number of students visiting per state and from overseas, 2013–14

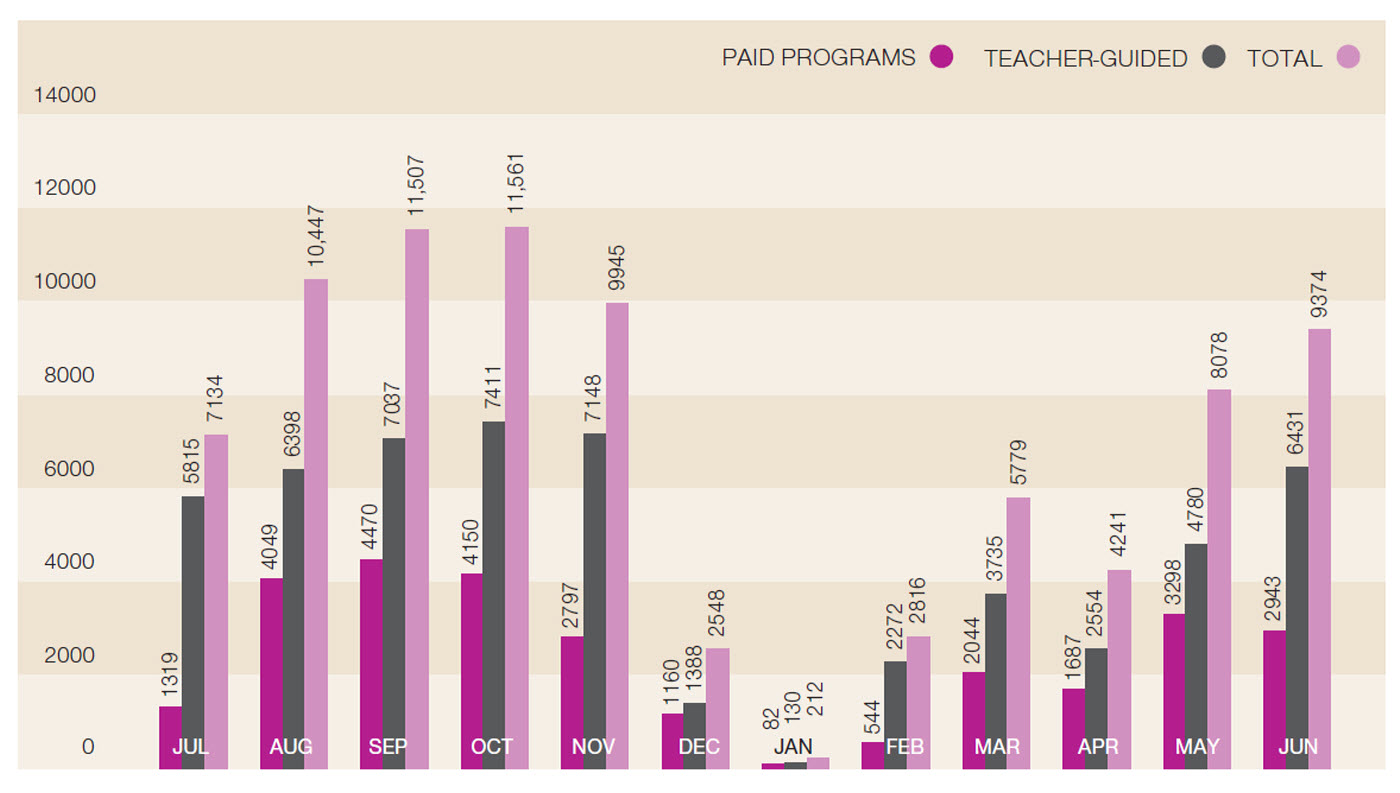
Number of paid program visits versus unpaid teacher-guided visits, 2013–14
Audience and visitor research
‘Thank you. I’m really impressed in particular by how you manage to make participation so non-threatening and fun for those of us who are a little shy.’
Museum visitor, Night at the Museum: Superstition
The Museum conducts interviews to obtain audience feedback and invites visitors to provide written feedback through a variety of channels, including forms, online feedback, and through visitor services hosts.
During 2013–14, the Museum conducted 912 surveys for a variety of Museum programs. Of these:
- 96 per cent of visitors were satisfied or very satisfied with their visit
- first-time visitors made up 27 per cent of those surveyed, while 48 per cent were frequent visitors to the Museum and had visited the Museum up to four times in the last twelve months.
The majority (77 per cent) of participants in the Museum’s public programs live in the Australian Capital Territory, while 21 per cent are from interstate and two per cent are international visitors.
A focus on client service
The Museum’s Client Service Charter is available to the public on the Museum’s website. During the year, the Museum received 328 written comments from visitors using the Visitor Feedback form, about the same as the previous year. The majority of comments were positive, and half of the positive responses referred to the Museum’s hosts and guided tours. Negative feedback accounted for about 20 per cent of total references with car parking, the Museum Cafe and wayfinding accounting for the majority.
The Museum received 1404 emails through the information@nma.gov.au and yourcomments@nma.gov.au email addresses, an increase of 12 per cent on the number received in 2012–13. These emails covered many subjects, including conservation questions, offers to donate objects, requests to assist with image reproduction or research, recruitment and venue hire.