This financial year, the Museum introduced a new visitation reporting methodology in response to the new key performance indicators (KPIs) introduced by the Office for the Arts (OFTA) to establish consistent reporting approaches across all arts agencies within the portfolio.
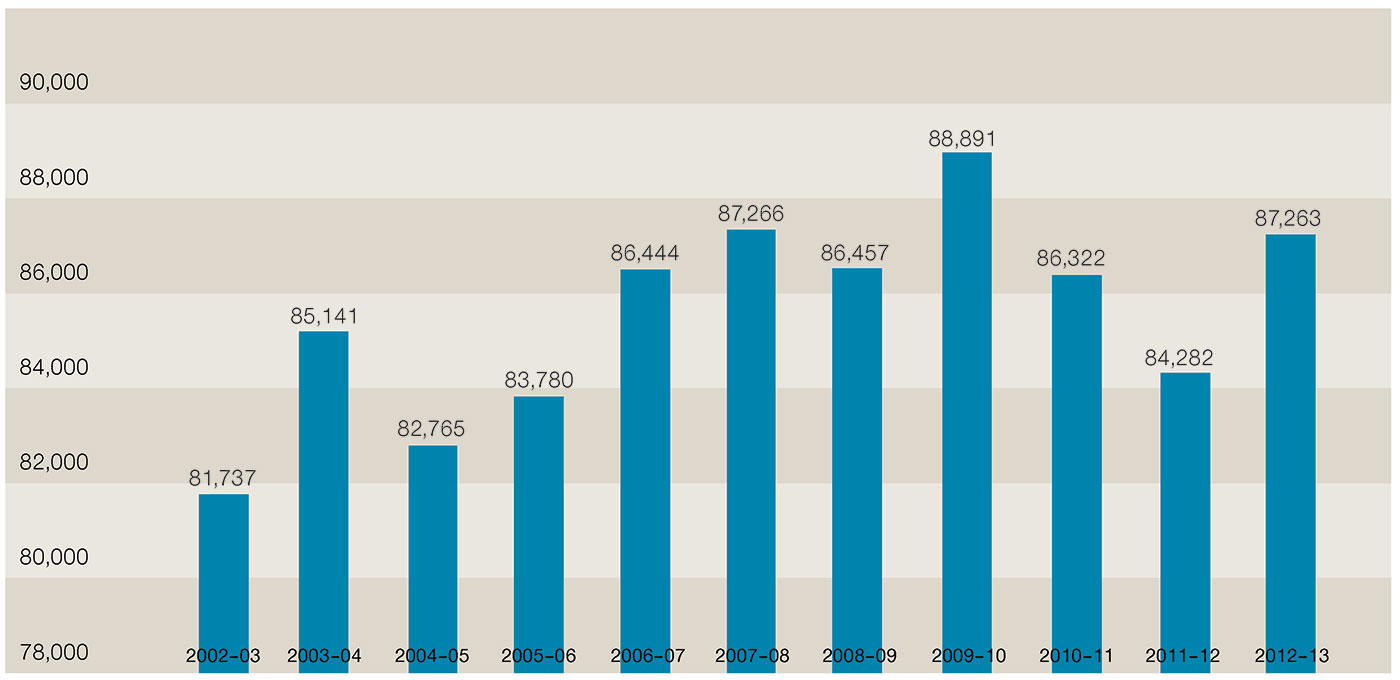
Visitation to the Museum’s main Acton site for 2012–13 was 2 per cent above the estimated target and schools visitation remained strong at 87,263, 3.5 per cent above the estimated target of 84,300. Attendance at public programs and events was 27,541, 7 per cent above the target of 25,640.
Total visitation to our temporary exhibitions was 73,413, 13 per cent below estimates over the course of the financial year. In part, this was because the Museum’s experimental program in this space, Museum Workshop: The Art, Science and Craft of the Conservator, was a hybrid work — half exhibition, half public program — which had fewer visitors than a major exhibition, but at a significantly lower cost. Visitation to the paid exhibition, Glorious Days: Australia 1913, was also slightly below estimates in what has proved to be a crowded celebratory year for the Canberra Centenary.
Travelling exhibition numbers were 85,186, 51 per cent below the estimated target of 175,000. This variation was due to two factors. Firstly, the delay of the touring program for our major touring exhibition Inside: Life in Children’s Homes and Institutions, which will now tour to venues in 2013–14. Secondly, the extended timetable for building works at the Museum’s Acton site had some impact on the organisation’s capacity to travel exhibitions in the course of the financial year. Total visitation for 2012–13 was 2,278,424 (including 727,674 visitors to Acton and travelling exhibitions and 1,550,750 online visitors).
Visits to the Museum’s websites were well above the target of 1,101,700, exceeding the estimates for the year by 52 per cent. While this was a good result it did represent an apparent drop on website visitation recorded in the previous financial year. In part, this is due to a departmental requirement that all cultural institutions now use Google Analytics to measure website visitation, rather than the server-side analytics software (ClickTracks) previously employed by the Museum. Google Analytics does not record requests for PDF, audio, video, Flash or other file types that constitute a component of the Museum’s web traffic. The new reporting also does not include social media engagement (such as with Facebook, Twitter, Flickr or YouTube), which the Museum formerly included in these statistics. However, the new approach, employing a methodology that is now common to all agencies in the portfolio, establishes a benchmark against which future growth can be measured.
The reduction in the Museum’s temporary exhibition and touring program for 2012–13, due in large part to its decision to focus resources on major physical redevelopments at the main Acton site, have meant that total visitation figures (exclusive of web visitation) have fallen below the high figures reported in preceding years. This impact was expected and the Museum is now moving to re-establish its touring program in a sustainable fashion over future years.
Audience and visitor research
The Museum conducts exit interviews to obtain audience feedback and invites visitors to provide written feedback through a variety of channels, including forms, online feedback, and through hosts who interact with the public and program staff.
Since opening in 2001, the Museum has recorded all exit interviews in a database that enables the analysis of visitor demographics, attitudes and behaviour over time. During 2012–13, the Museum conducted 400 exit interviews, focused on two peak visitation periods. Data indicated that 96 per cent of visitors were satisfied or very satisfied with their visit.
Of those interviewed:
- the majority (67 per cent) were aged over 66 years, followed by 10 per cent of visitors between 36 and 45 years of age
- the largest group of visiting children were aged between 5 and 11 years of age
- 38 per cent of those surveyed were visiting the Museum for the first time, followed by 23 per cent who had previously visited the Museum more than 10 times
- 44 per cent of those surveyed lived in the Canberra region, 45 per cent lived in other parts of Australia, while 11 per cent were visitors from overseas.
A focus on client service
The Museum’s Client Service Charter is available to the public on the Museum’s website. During the year, the Museum received 326 written comments from visitors using the Visitor Feedback form, an increase of 17 per cent on the previous year. Feedback was received on services, programs, exhibitions, the building and facilities.
A total of 1250 emails were received through the information@nma.gov.au and yourcomments@nma.gov.au email addresses, an increase of 11 per cent on the number received in 2011–12. These emails covered many subjects, including conservation questions, offers to donate objects, requests to assist with image reproduction or research, recruitment and venue hire.
The majority of the feedback was positive, citing successful Museum visits. In particular, visitors commented on the temporary exhibitions program, the large objects installed in the Main Hall, tours and the new Museum Cafe. Interestingly, the largest proportion of negative feedback also included the temporary exhibitions program, the displays in the Main Hall, the Museum Cafe and car parking.
Positive references to the service provided by the Museum’s hosts represented the highest number of visitor comments recorded using the Visitor Feedback Form, accounting for over 24 per cent of positive feedback received in 2012–13.
Changes were made to the Museum’s services, amenities and exhibitions as a direct result of visitor feedback, including the completion and installation of:
- signage and way-finding strategies
- a visitor introduction area
- an educational Think Spot
- car park improvement initiatives
- improved service procedures and menu options in the Museum Cafe.
Visitation numbers (excluding the web), 2001–13
| Financial year | Visitation |
|---|---|
| 2001–02 | 903,400 |
| 2002–03 | 825,000 |
| 2003–04 | 820,200 |
| 2004–05 | 666,200 |
| 2005–06 | 770,601 |
| 2006–07 | 945,210 |
| 2007–08 | 1,007,856 |
| 2008–09 | 941,361 |
| 2009–10 | 880,030 |
| 2010–11 | 1,580,574 |
| 2011–12 | 1,486,842 |
| 2012–13 | 727,674 |
Monthly web visitation figures, 2012–13
| Month | Visitation |
|---|---|
| July | 220,056 |
| August | 182,254 |
| September | 115,539 |
| October | 128,073 |
| November | 113,305 |
| December | 70,481 |
| January | 91,814 |
| February | 105,428 |
| March | 132,014 |
| April | 113,529 |
| May | 155,846 |
| June | 122,411 |
| Total | 1,550,750 |
Breakdown of visitation numbers (excluding the web), 2006–13
| Year | 2006–07 | 2007–08 | 2008–09 | 2009–10 | 2010–11 | 2011–12 | 2012–13 |
|---|---|---|---|---|---|---|---|
| Permanent exhibitions | 418,790 | 393,141 | 366,541 | 489,888 | 447,598 | 407,786 | 452,947* |
| Temporary exhibitions | 105,710 | 89,348 | 95,417 | 91,464 | 255,380 | 197,092 | 73,413 |
| Travelling exhibitions | 248,641 | 372,407 | 344,512 | 163,388 | 736,811 | 753,387 | 85,186 |
| Public programs and events | 53,097 | 33,297 | 29,649 | 28,166 | 36,653 | 37,891 | 27,541 |
| Schools | 86,444 | 87,266 | 86,457 | 88,981 | 83,293 | 84,282 | 87,263 |
| Functions/venue hire | 32,528 | 32,397 | 18,785 | 18,143 | 20,839 | 6404 | 1324 |
| Total | 945,210 | 1,007,856 | 941,361 | 880,030 | 1,580,574 | 1,486,842 | 727,674 |
*2012–13 figures include visitors to the Main Hall, which now displays large objects from the National Historical Collection
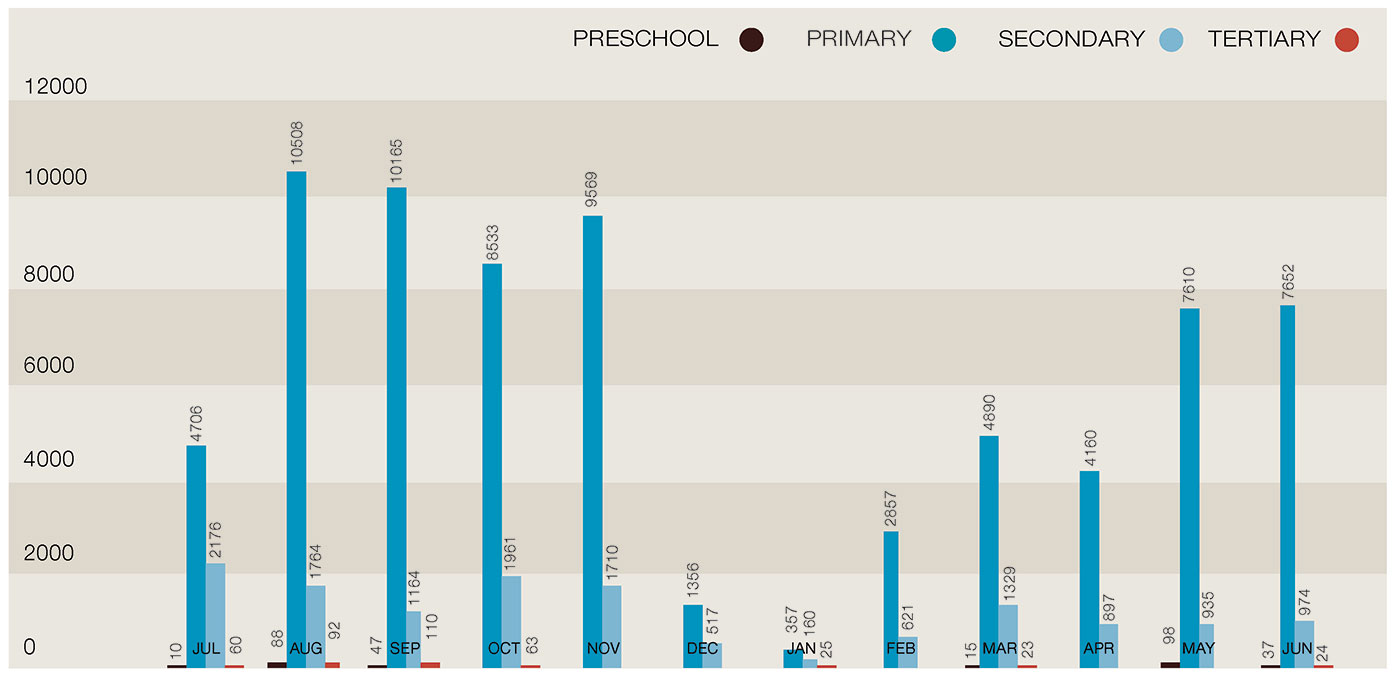
Student levels, 2012–13
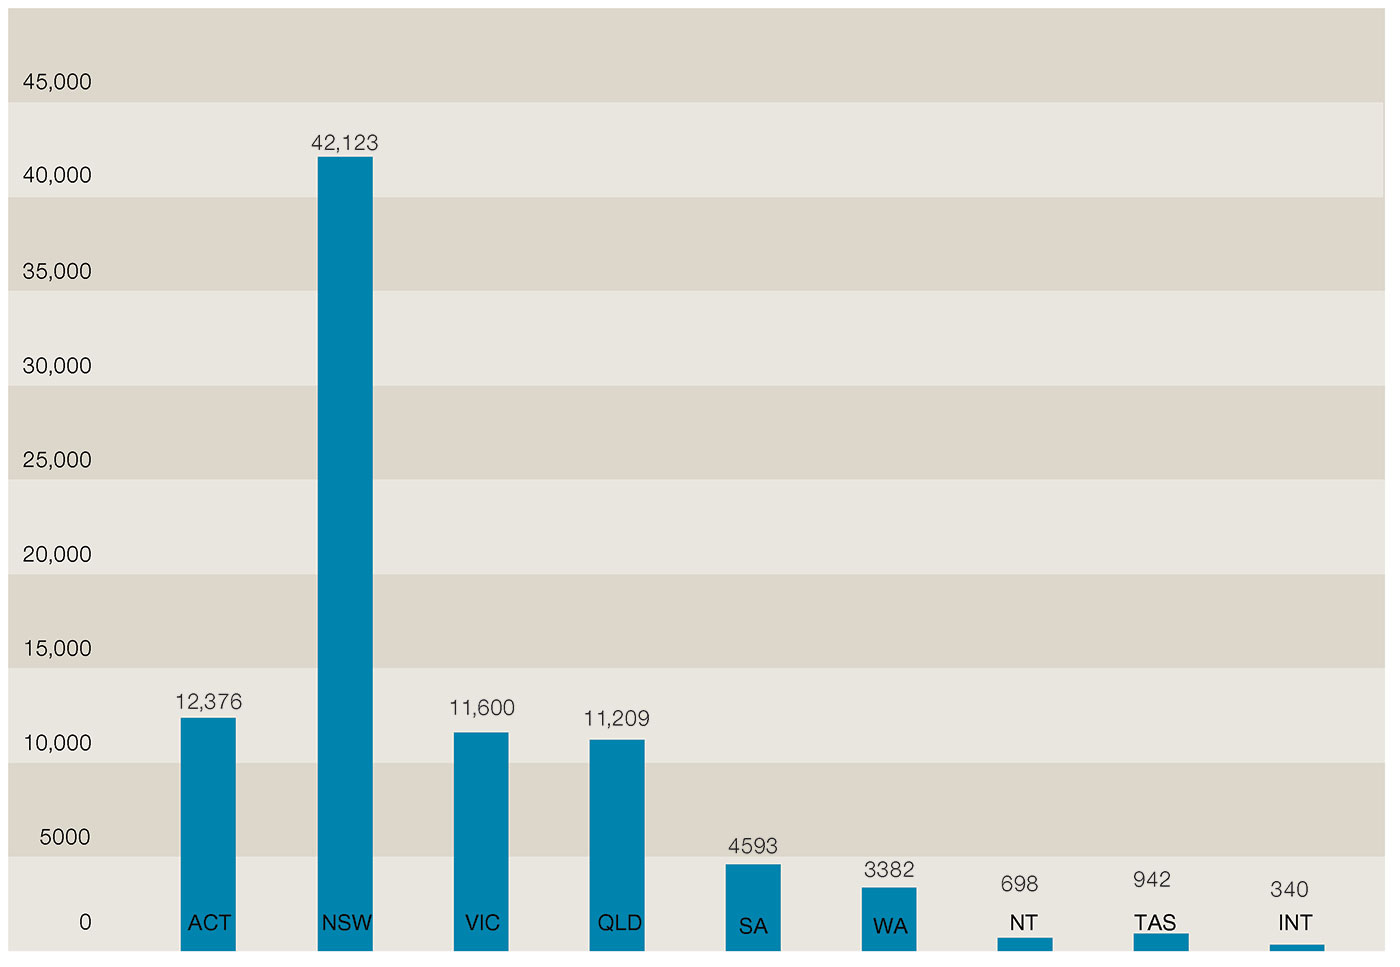
Number of students visiting per state and from overseas, 2012–13
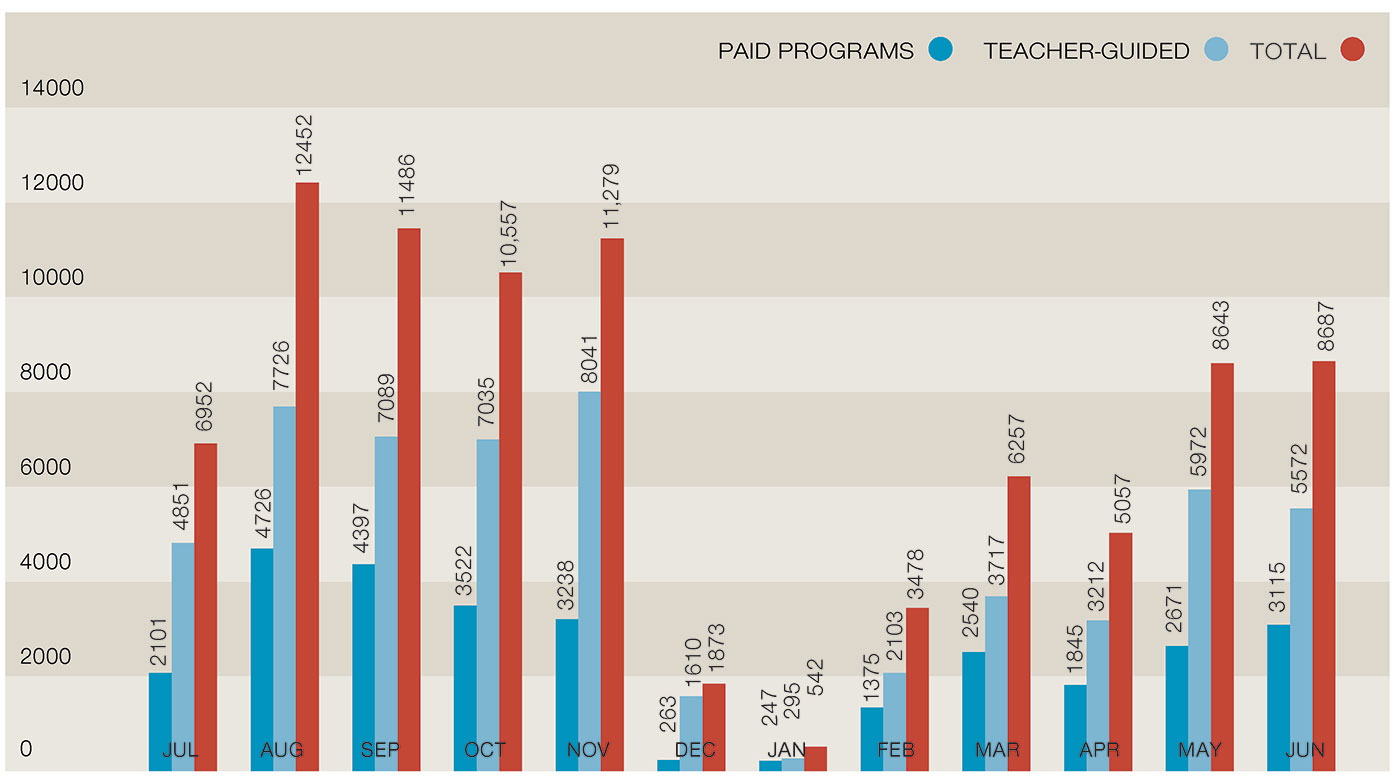
Number of paid program visits versus unpaid teacher-guided visits, 2012–13
Total student visitation, 2002–13
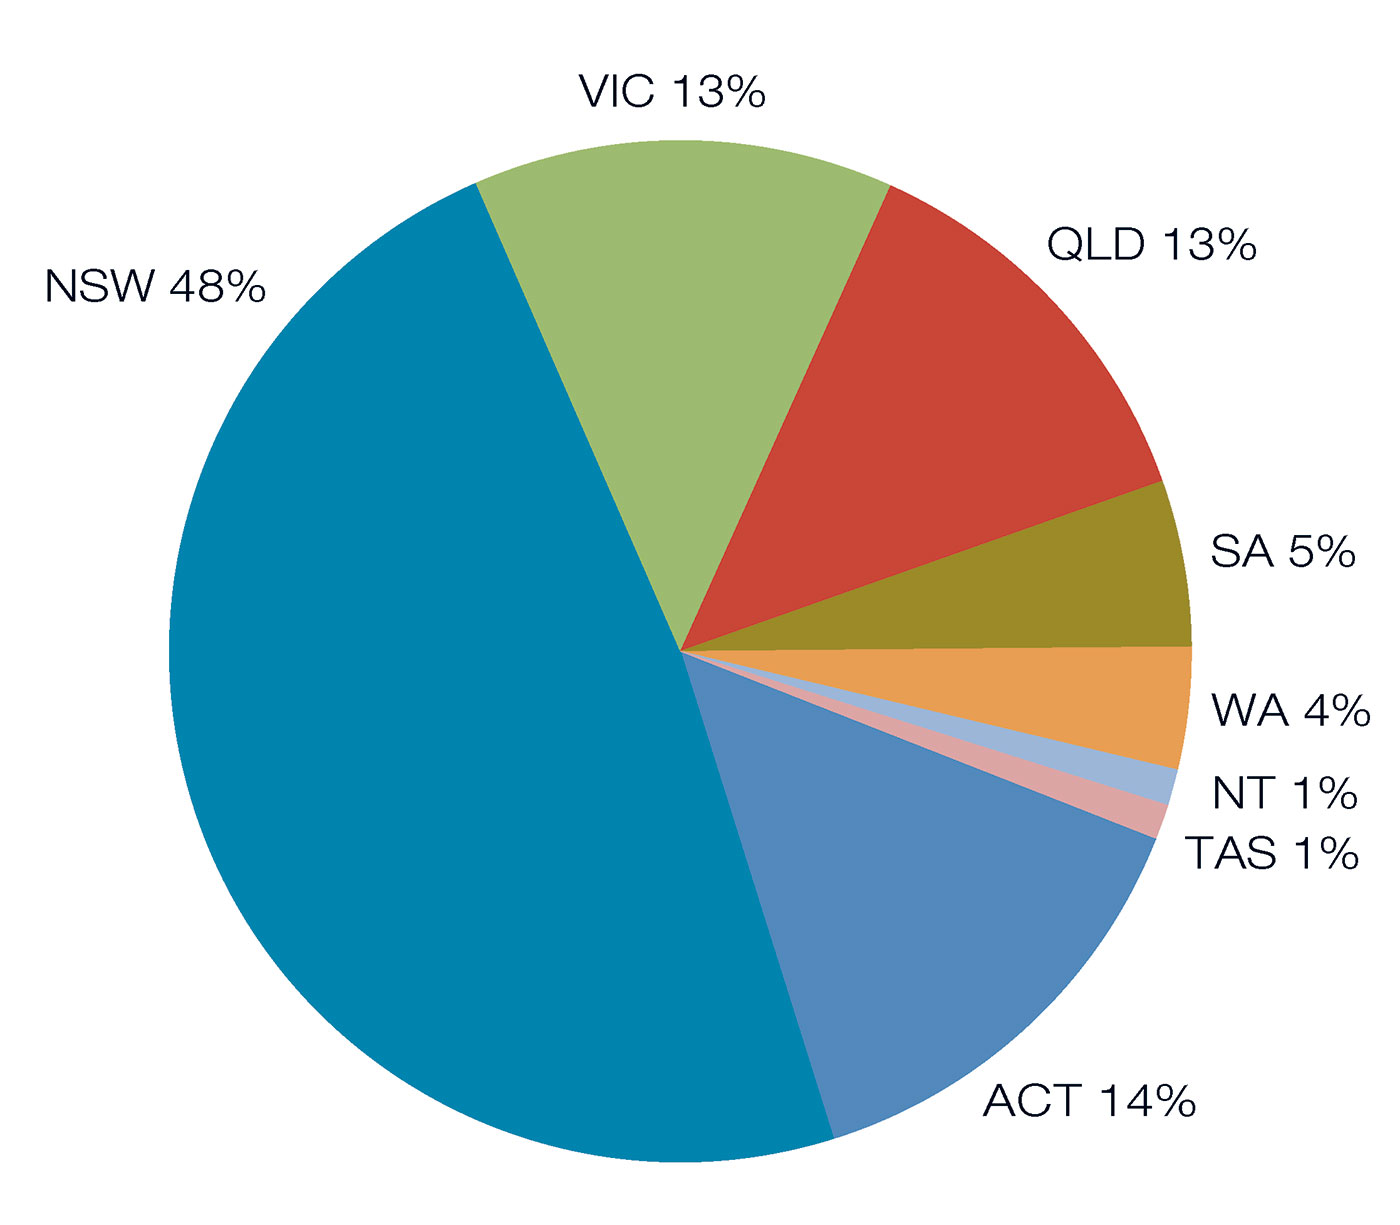
Percentage of schools bookings per state, 2012–13