Visitation for 2011–12 was a record 5,297,000 (including 1,487,000 visitors to Acton and travelling exhibitions and 3,810,000 online visitors). This was an increase of 7 per cent in total visitation with a 13 per cent increase in web visitation and a 6 per cent decline in the number of visitors and users of the Museum’s exhibitions and programs. These figures are attributed to:
- strong temporary exhibition visitation
- further development of the Museum’s rich and diverse website, which attracted record visitation
- an increase of visitors to public programs and events with record attendance for the Autumn and Winter festivals, reflecting the continued popularity of both regular and new programs
- an increase in visitation to travelling exhibitions due to the large number of exhibitions travelling to major cities
- continued high visitation by schools
- a substantial decline in functions and venue hire numbers as the Museum ceased to offer venues for hire while undergoing building works
- a decline in permanent exhibitions visitation.
Visitation numbers (excluding the web), 2001–12
| Financial year | Visitation |
|---|---|
| 2001–02 | 903,400 |
| 2002–03 | 825,000 |
| 2003–04 | 820,200 |
| 2004–05 | 666,200 |
| 2005–06 | 770,601 |
| 2006–07 | 945,210 |
| 2007–08 | 1,007,856 |
| 2008–09 | 941,361 |
| 2009–10 | 880,030 |
| 2010–11 | 1,580,574 |
| 2011–12 | 1,486,842 |
Monthly web visitation figures, 2011–12
| Month | Visitation |
|---|---|
| July | 332,706 |
| August | 396,556 |
| September | 360,146 |
| October | 382,891 |
| November | 366,898 |
| December | 170,633 |
| January | 237,876 |
| February | 273,471 |
| March | 381,810 |
| April | 259,350 |
| May | 315,948 |
| June | 331,429 |
| Total | 3,810,714 |
Breakdown of visitation numbers (excluding the web), 2006–12
| Year | 2006–07 | 2007–08 | 2008–09 | 2009–10 | 2010–11 | 2011–12 |
|---|---|---|---|---|---|---|
| Permanent exhibitions | 418,790 | 393,141 | 366,541 | 489,888 | 447,598 | 407,786 |
| Temporary exhibitions | 105,710 | 89,348 | 95,417 | 91,464 | 255,380 | 197,092 |
| Travelling exhibitions | 248,641 | 372,407 | 344,512 | 163,388 | 736,811 | 753,387 |
| Public programs and events | 53,097 | 33,297 | 29,649 | 28,166 | 36,653 | 37,891 |
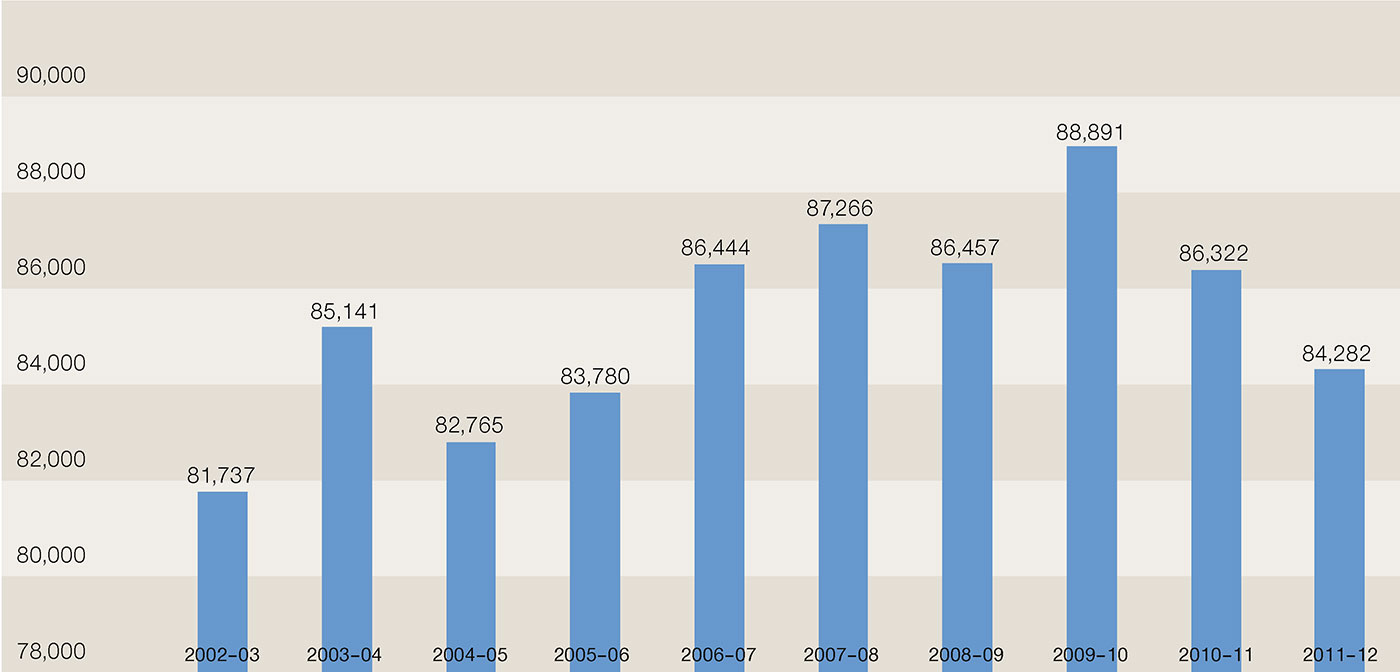
| Schools | 86,444 | 87,266 | 86,457 | 88,981 | 83,293 | 84,282 |
| Functions/venue hire | 32,528 | 32,397 | 18,785 | 18,143 | 20,839 | 6,404 |
| Total | 945,210 | 1,007,856 | 941,361 | 880,030 | 1,580,574 | 1,486,842 |
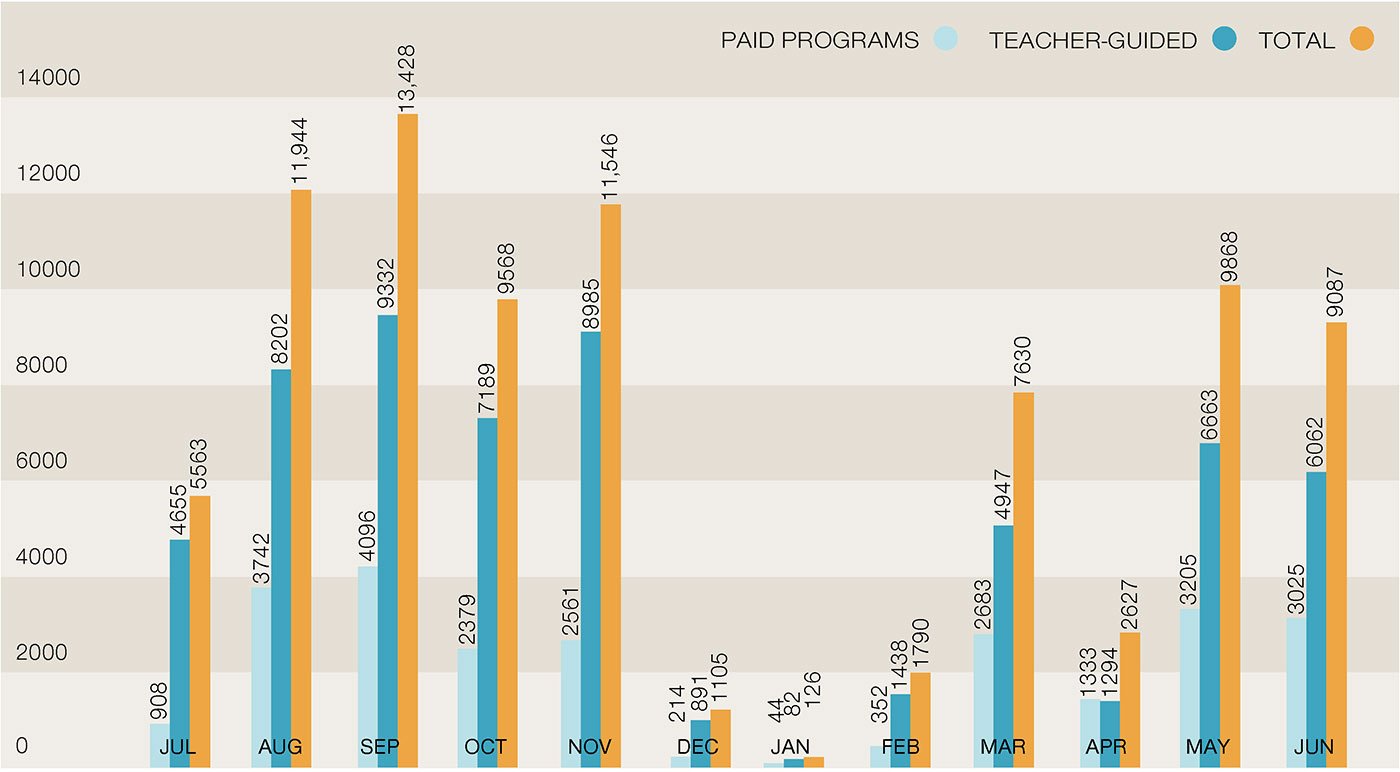
Number of paid program visits versus unpaid teacher-guided visits, 2011–12
Total student visitation, 2002–12
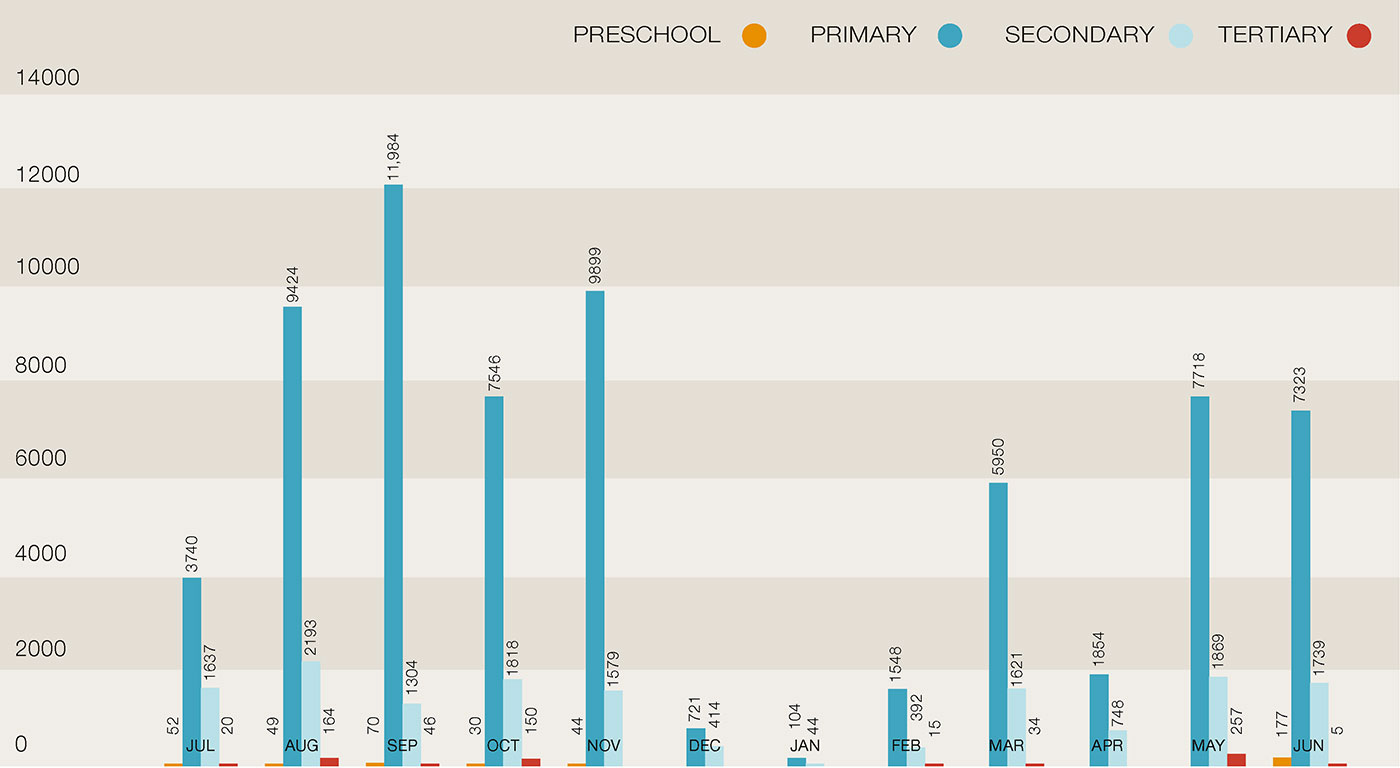
Student levels, 2011–12
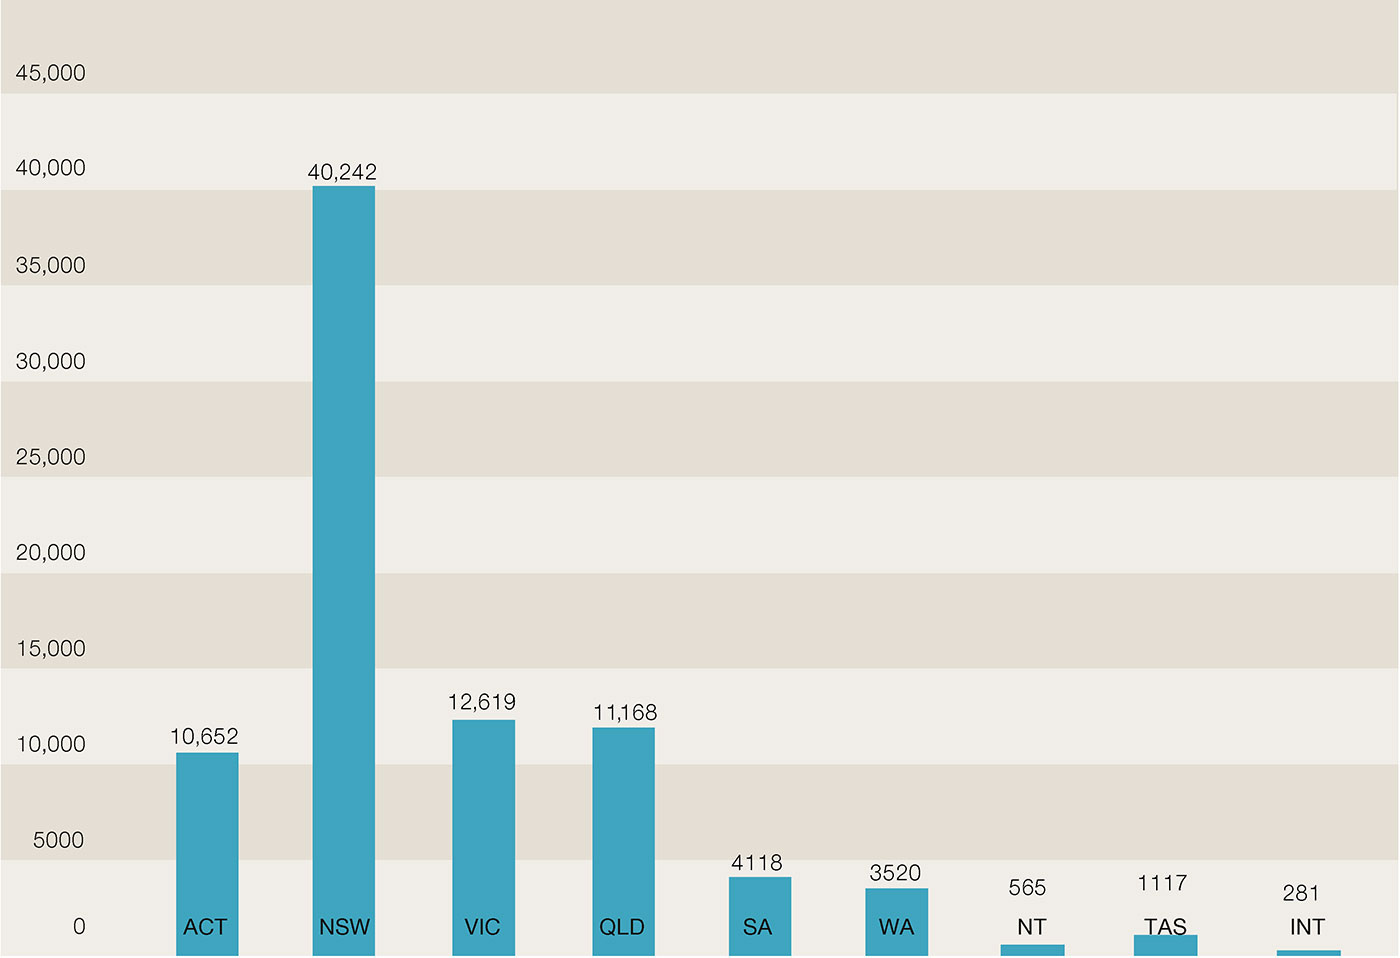
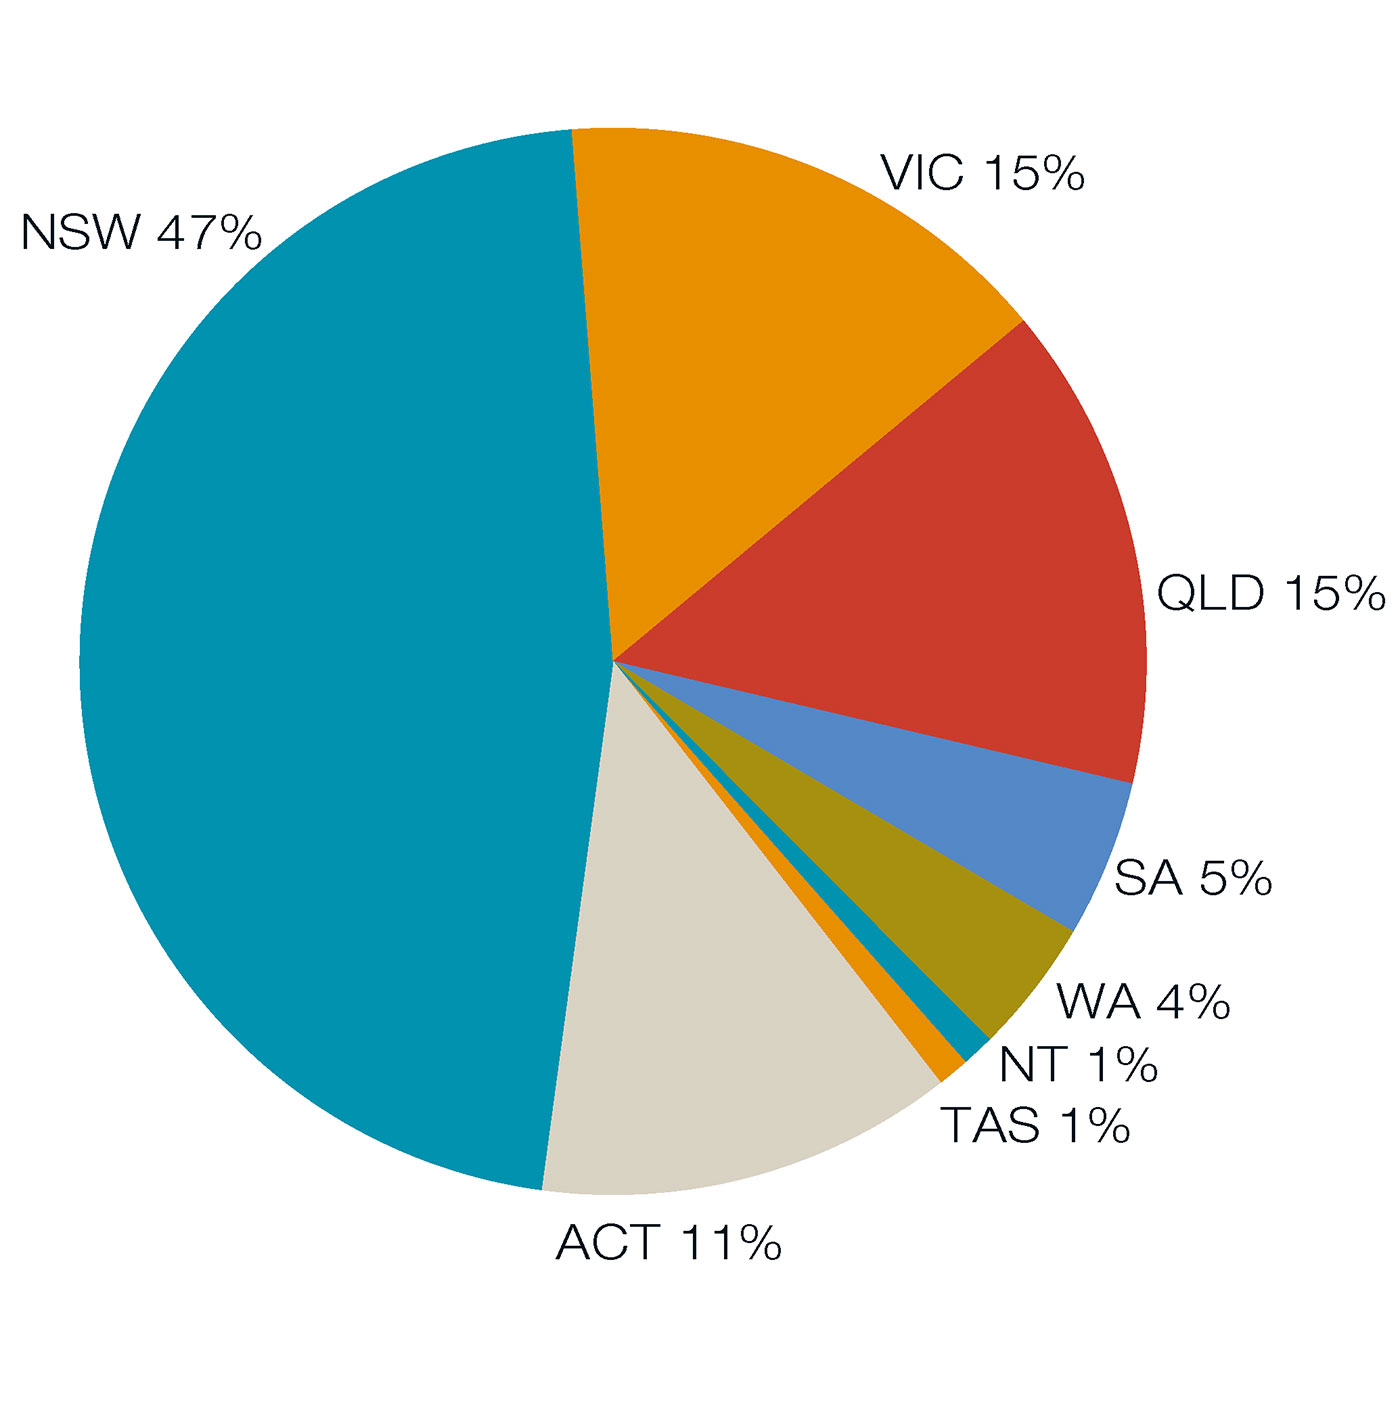
Number of students visiting per state and from overseas, 2011–12
Percentage of schools bookings per state, 2011–12
Audience and visitor research
The Museum actively seeks comments from visitors by conducting exit interviews, commissioning audience research and inviting visitors to provide written feedback through feedback forms. Informal comments are also noted by visitor services hosts and Public Programs staff. Since opening in 2001, the Museum has recorded all exit interviews in a database that enables the analysis of visitor demographics, attitudes and behaviour over time. This year, the Museum conducted 450 exit interviews with 95 per cent of visitors expressing satisfaction with their visit.
In 2011–12, visitors aged 60 years and over were the most strongly represented, and the proportion of repeat visitors was 65 per cent overall. Fifty-four per cent of visitors interviewed during the year had visited the Museum three or more times. Half of the Museum’s visitors were from Canberra, 25 per cent were from New South Wales and 6 per cent were from Victoria.
A focus on client service
The Museum’s Client Service Charter is available to the public on the Museum’s website. During the year, the Museum received 277 written comments from visitors using the Visitor Feedback form. Feedback was received on services, programs, exhibitions, the building and facilities.
A total of 1123 emails were received through the information@nma.gov.au and yourcomments@nma.gov.au email addresses, a decrease of 10 per cent compared with 2010–11. These emails covered many subjects, including conservation questions, offers to donate objects, requests to assist with image reproduction or research, and venue hire.
The majority of the feedback was positive, reporting successful visits to the permanent galleries and temporary exhibitions. In particular, visitors commented on the temporary exhibitions program and the redeveloped Landmarks gallery. Wayfinding and lighting issues represented the largest proportion of negative feedback.
Changes to the Museum’s services, amenities and exhibitions were made as a direct result of visitor feedback, including the development of:
- signage and wayfinding strategies
- a visitor introduction area
- an education ‘Think Spot’
- car park improvement initiatives.
Positive references to the service provided by the visitor services hosts represented the highest number of visitor comments recorded using the Visitor Feedback Form, accounting for over 22 per cent of all feedback received in 2011–12.