Visitation for 2010–11 was 4,960,348 (including 1,580,574 visitors to Acton and travelling exhibitions and 3,379,774 online visitors). The year’s visitation was up 19 per cent from 2009–10 and was marked by:
- a significant increase in visitors to temporary exhibitions due to the popularity of Yiwarra Kuju: The Canning Stock Route and Not Just Ned: A True History of the Irish in Australia
- a major increase in visitation to travelling exhibitions due to the large number of exhibitions travelling to major cities, including Beijing, in 2010–11
- a notable increase in visitors to public programs and events, which reflects the continued popularity of both regular and new programs, and record attendance for the summer and autumn festival days.
Web visitation has grown slightly from 3,291,874 in 2009–10 to 3,379,774 in 2010–11. The most interesting trend was the increasing share of online engagement through social media, which accounted for approximately 160,000 visits in 2010–11 compared with about 60,000 in 2009–10.
Visitation numbers (excluding the web), 2001–11
| Financial year | Visitation |
|---|---|
| 2001–02 | 903,400 |
| 2002–03 | 825,000 |
| 2003–04 | 820,200 |
| 2004–05 | 666,200 |
| 2005–06 | 770,601 |
| 2006–07 | 945,210 |
| 2007–08 | 1,007,856 |
| 2008–09 | 941,361 |
| 2009–10 | 880,030 |
| 2010–11 | 1,580,574 |
Monthly web visitation figures, 2010–11
| Month | Visitation |
|---|---|
| July | 246,860 |
| August | 327,576 |
| September | 282,586 |
| October | 305,637 |
| November | 284,843 |
| December | 202,325 |
| January | 221,663 |
| February | 233,989 |
| March | 320,052 |
| April | 272,337 |
| May | 353,593 |
| June | 328,313 |
| Total | 3,379,774 |
Breakdown of visitation numbers (excluding the web), 2005–11
| Location | 2005–06 | 2006–07 | 2007–08 | 2008–09 | 2009–10 | 2010–11 |
|---|---|---|---|---|---|---|
| Permanent exhibitions | 428,123 | 418,790 | 393,141 | 366,541 | 489,888 | 447,598 |
| Temporary exhibitions | 91,101 | 105,710 | 89,348 | 95,417 | 91,464 | 255,380 |
| Travelling exhibitions | 63,762 | 248,641 | 372,407 | 344,512 | 163,388 | 736,811 |
| Public programs and events | 69,061 | 53,097 | 33,297 | 29,649 | 28,166 | 36,653 |
| Schools | 83,780 | 86,444 | 87,266 | 86,457 | 88,981 | 83,293 |
| Functions/venue hire | 34,234 | 32,528 | 32,397 | 18,785 | 18,143 | 20,839 |
| Total | 770,601 | 945,210 | 1,007,856 | 941,361 | 880,030 | 1,580,574 |
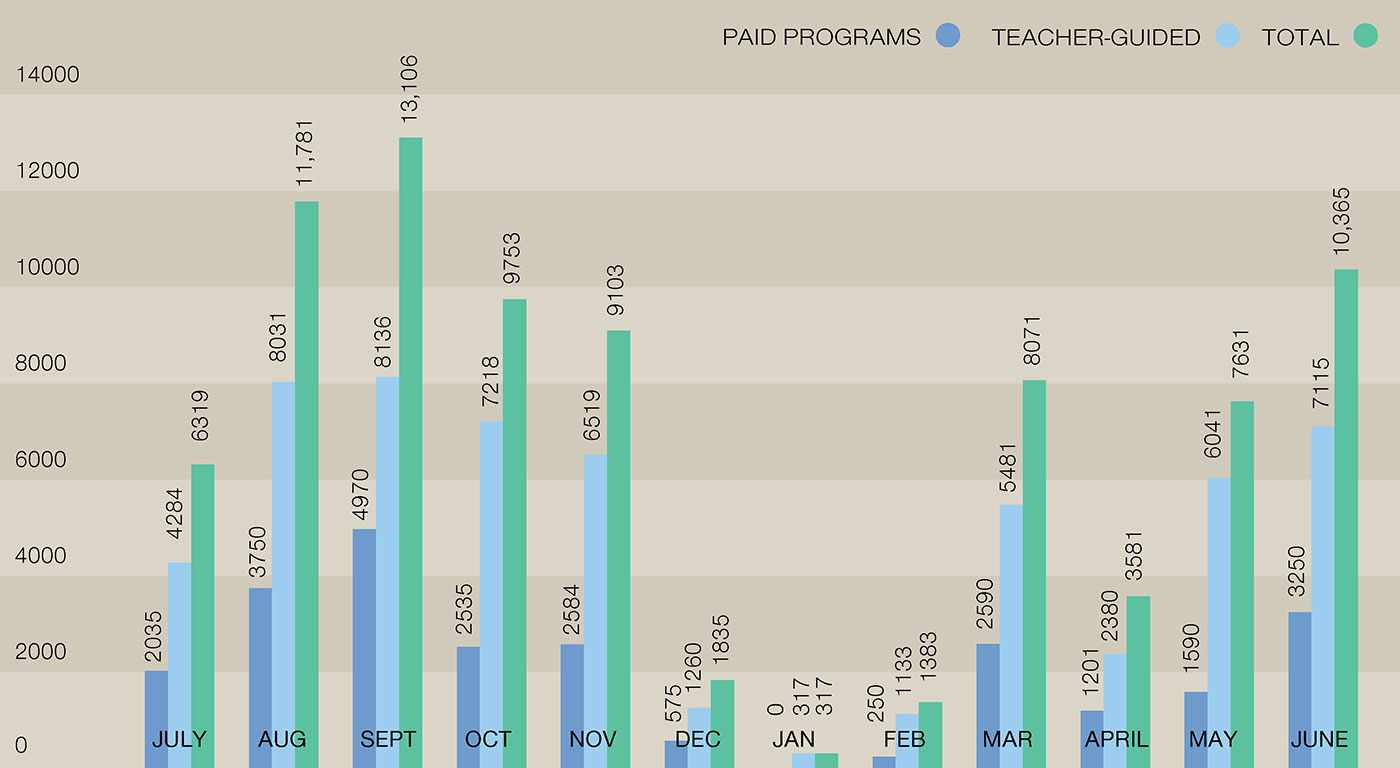
Number of paid versus teacher-guided student visits,* 2010–11
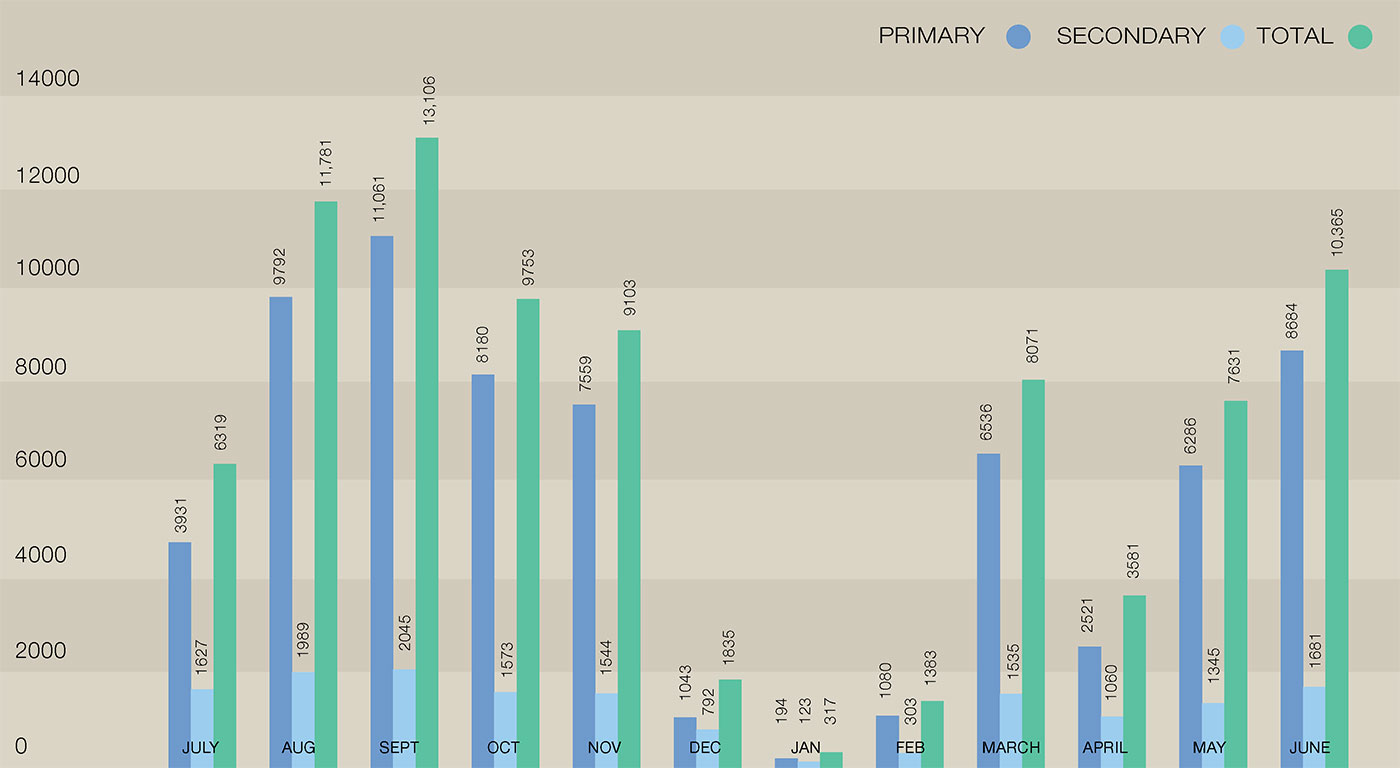
Number of primary versus secondary students, 2010–11
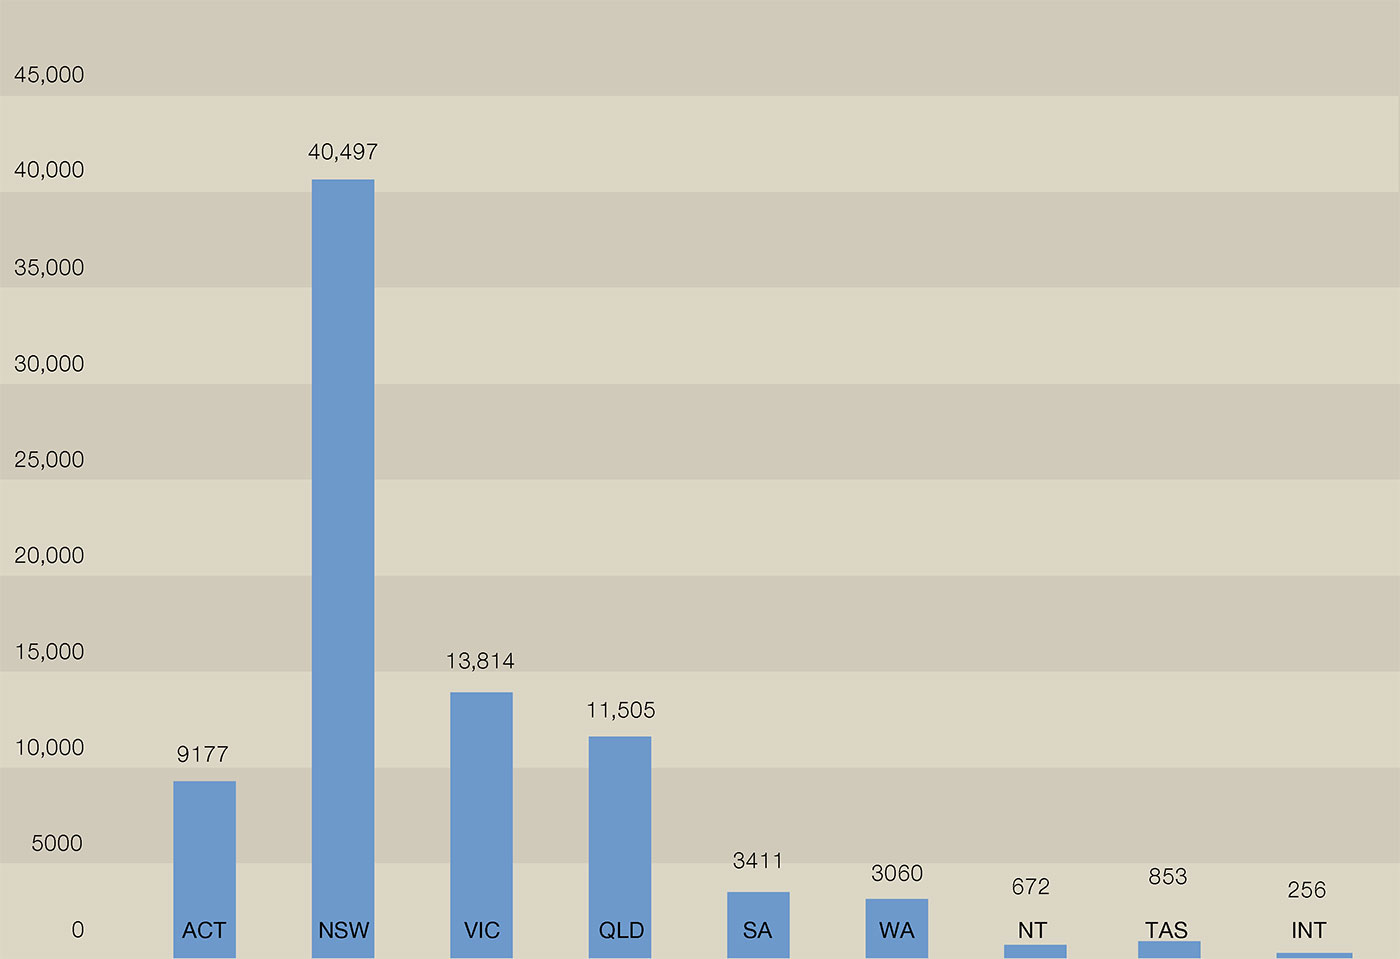
Number of students visiting per state and internationally, 2010–11
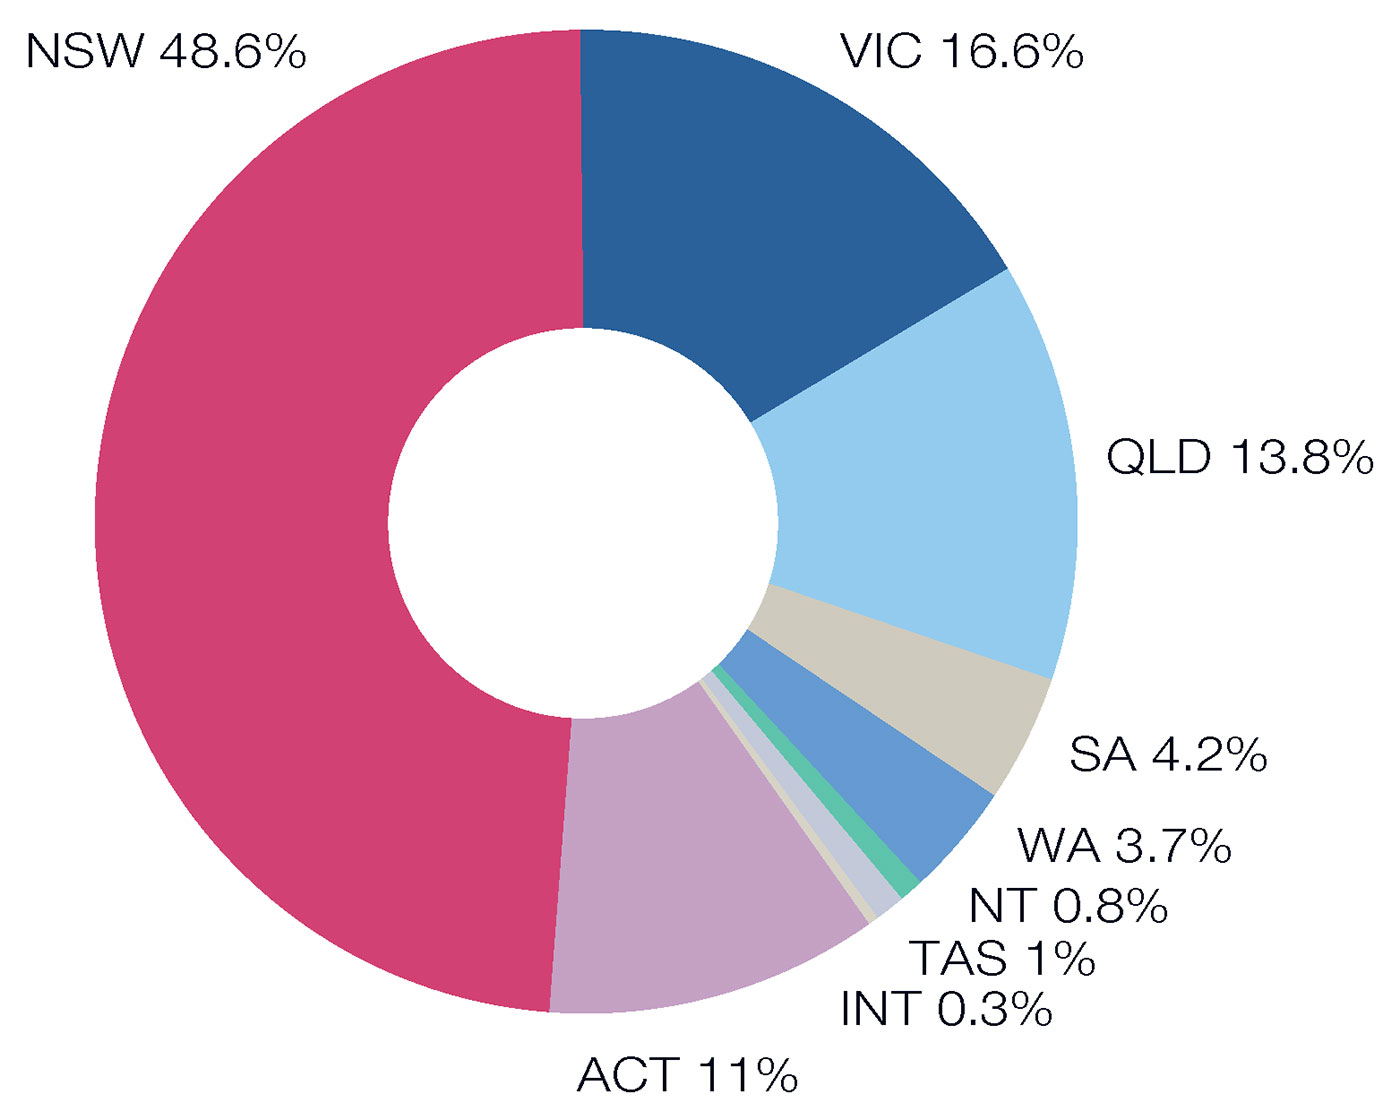
Percentage of school bookings per state and internationally, 2010–11
Comparison of student visitation numbers, 2002–11
| Financial year | Total visitation |
|---|---|
| 2002–03 | 81,737 |
| 2003–04 | 85,141 |
| 2004–05 | 82,765 |
| 2005–06 | 83,780 |
| 2006–07 | 86,444 |
| 2007–08 | 87,266 |
| 2008–09 | 86,457 |
| 2009–10 | 88,891 |
| 2010–11 | 83,293 |
Audience and visitor research
The Museum actively seeks comments from visitors by conducting exit interviews, commissioning audience research and inviting visitors to provide written feedback through feedback forms. Informal comments are also noted by visitor services hosts and Public Programs staff. Since opening in 2001, the Museum has recorded all exit interviews into a database that enables the analysis of visitor demographics, attitudes and behaviour over time. This year, the Museum conducted 401 exit interviews, along with 250 interviews of visitors to temporary exhibitions.
In 2010–11, visitors aged 60 years and over were the most strongly represented, and the proportion of repeat visitors was 55 per cent overall. Forty-three per cent of visitors interviewed during the year had visited the Museum three or more times. Thirty-nine per cent of visitors were from Canberra, 26 per cent were from New South Wales and 19 per cent were from Victoria.
A focus on client service
The Museum’s Client Service Charter is available to the public as a brochure and on the Museum’s website. During the year the Museum received 278 written comments from visitors using the Client Service Charter feedback form. Feedback was received on services, programs, exhibitions, the building and facilities.
A total of 1250 emails were received through the information@nma.gov.au email address, an increase of just over 17.5 per cent compared with 2009–10. These emails covered many subjects including conservation questions, and offers to donate objects or assist with image reproduction or research.
The majority of the feedback was positive, reporting successful visits to the permanent galleries and temporary exhibitions. Visitors also commented on the positive contribution the Museum was making to reconciliation in Australia through Indigenous exhibitions and programs. Wayfinding and lighting issues represented the largest proportion of negative feedback.
Changes to the Museum’s services, amenities and exhibitions were made as a direct result of visitor feedback, including:
- improved accessibility for visitors with special needs
- further improvements in lighting in the permanent exhibition areas.
Positive references to the service provided by the visitor services hosts represented the highest number of visitor comments recorded using the Client Service Charter, accounting for over 35 per cent of all feedback received in 2010–11. This is an increase of 16.1 per cent compared with 2009–10.